This guide will help you to understand how OpenSIPS can be monitored with Zabbix, sharing its statistic data via HTTP interface in JSON format. This article assumes using OpenSIPS 3.2 and Zabbix 6.
Enable embedded HTTP server and HTTP support for Management Interface in your OpenSIPS:
loadmodule "httpd.so"
modparam("httpd", "ip", "192.168.88.244")
modparam("httpd", "port", 8888)

# :8888/mi
loadmodule "mi_http.so"
modparam("mi_http", "root", "mi")
Now we may try to send a JSON-RPC OpenSIPS MI command from the command-line, using curl (official example at the very bottom of the page):
/usr/bin/curl -X POST 192.168.88.244:8888/mi -H 'Content-Type: application/json' -d '{"jsonrpc": "2.0", "id": "1", "method": "uptime"}'
The official documentation does not have other more complicated examples, e.g. “get_statistics sl:”, that’s why I decided to write this article, maybe it’s more about JSON, JSONPath and working with all this in Zabbix.
As an example, we’ll get stateless replier module statistics, like shown by invoking a CLI command “opensips-cli -x mi get_statistics sl:” .
/usr/bin/curl -X POST 192.168.88.244:8888/mi -H 'Content-Type: application/json' -d '{"jsonrpc": "2.0", "id": "1", "method": "get_statistics", "params": {"statistics": ["sl:"]}}'
I’ll also duplicate the command with a screenshot (to be sure that you see it in a right way, because markup may cut some special characters):

Tip: if you need statistics from several groups, for example several modules (not only SL), the request will be as follows:
/usr/bin/curl -X POST 192.168.88.244:8888/mi -H 'Content-Type: application/json' -d '{"jsonrpc": "2.0", "id": "1", "method": "get_statistics", "params": {"statistics": ["sl:", "tm:"]}}'
OpenSIPS will answer and you’ll see SL module statistics after sending this request with CURL.
But the responce is a one-liner, so we need to convert this one line to JSON format and then to create a JSONPath, to be able to extract the value we need.
Let’s monitor not all SL module statistics received from OpenSIPS, but the number of 2xx replies only.
I use https://www.jsonformatter.io/ for JSON formatting and https://jsonpath.com/ for creating JSONPath. After formatting and specifying JSONPath we can configure Zabbix.
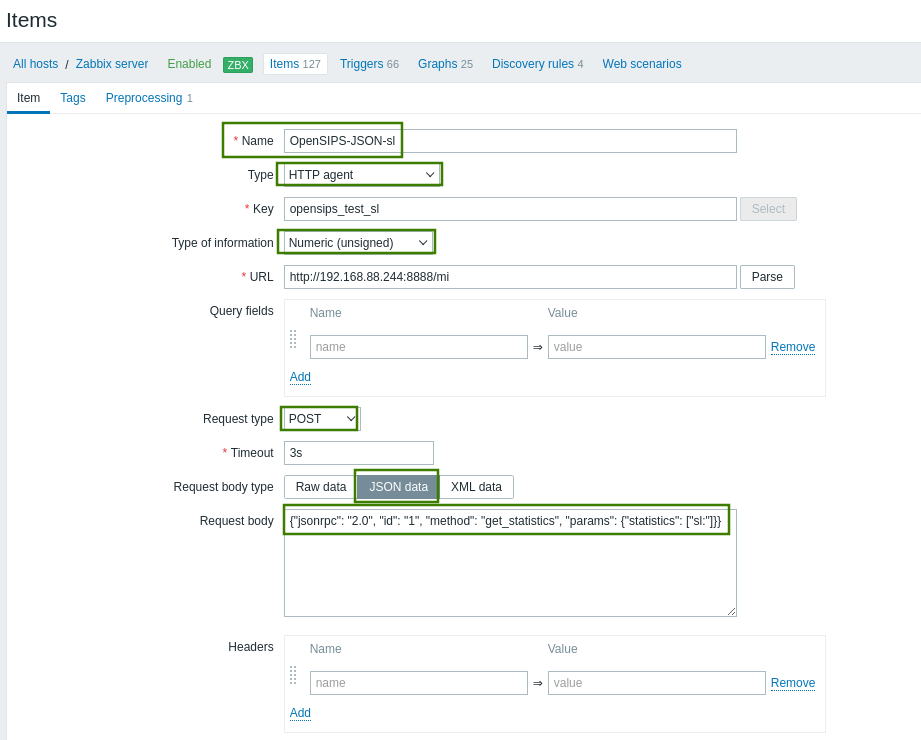
Now it’s time to add items to your OpenSIPS host in Zabbix. Item parameters:
Type: HTTP Agent
Type of information: Numeric (unsigned)
Request type: POST
Request body type: JSON data
Request body: {"jsonrpc": "2.0", "id": "1", "method": "get_statistics", "params": {"statistics": ["sl:"]}}
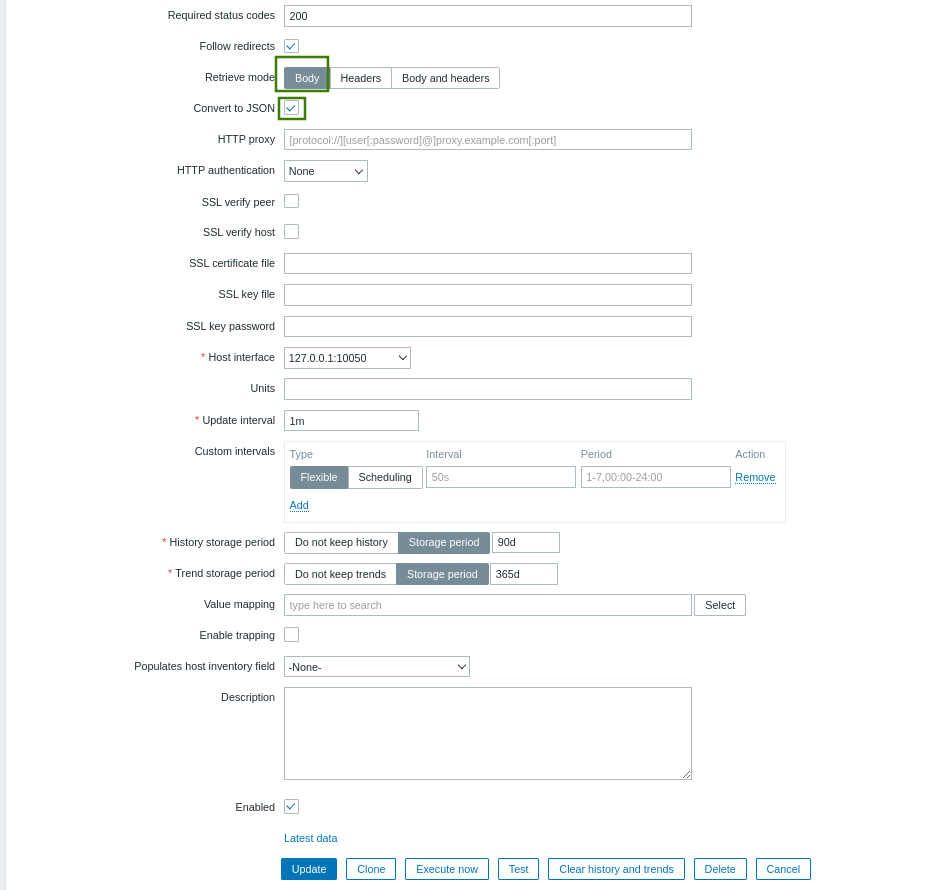
Retrieve mode: Body
Convert to JSON (enabled)
Screenshots as usual:
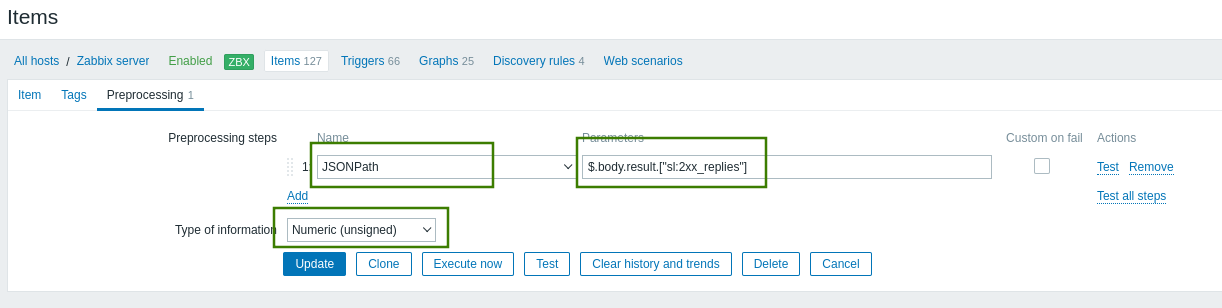
Item Preprocessing parameters:
1st step - JSONPath
Parameters: $.body.result.["sl:2xx_replies"]
Type of information: Numeric (unsigned)
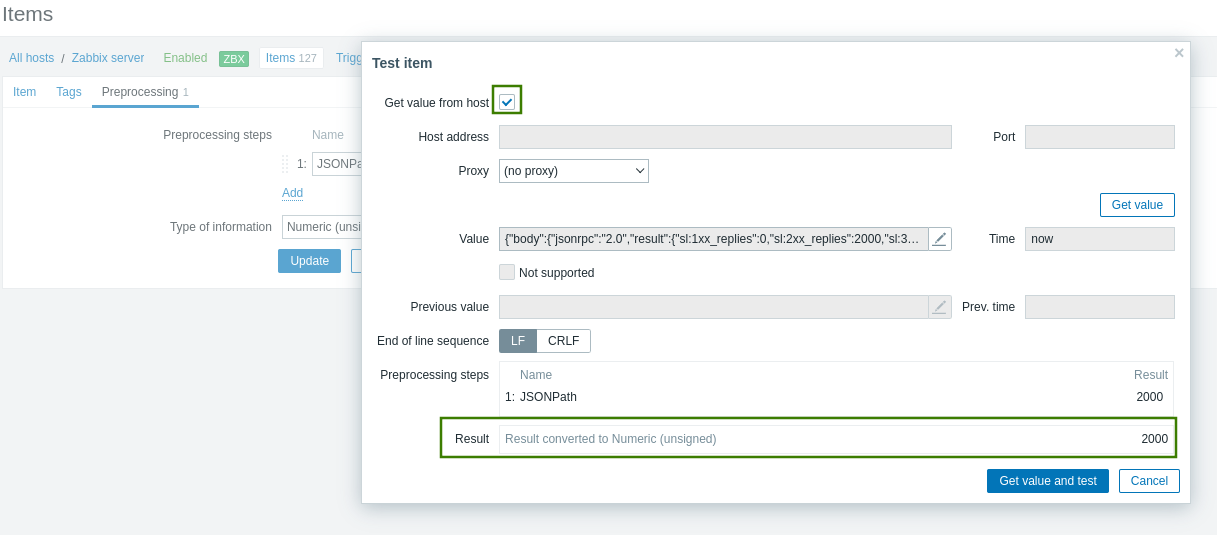
Screen – item Preprocessing and successful testing:
Now we add a graph with this item (I hope you know how to create graphs in Zabbix) and it’s time to test. I will generate thousands of OPTIONS requests to my OpenSIPS with the sipp tool (I also recommend this sipp cheatsheet).
Download OPTIONS.xml scenario file, and generate 10000 OPTIONS requests with call rate of 10 (I assume that your OpenSIPS, like mine, answers “200 OK”):
sipp 192.168.88.244 -sf OPTIONS.xml -l 10000 -m 10000 -r 10
Finally, here is the graph showing your OpenSIPS SL module 2xx processed replies statistics:
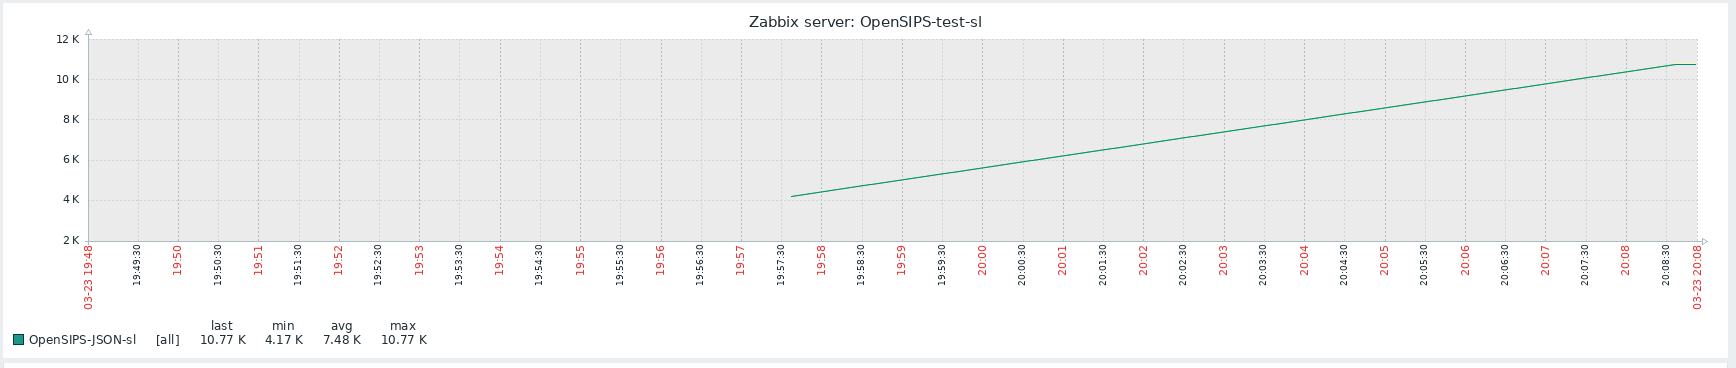
This is how you can monitor OpenSIPS with Zabbix using JSON.
Have fun!