This is almost the same as I’ve already posted.
The difference is that now we will kill dialogs not based by the remote side IP address, but based on datestart. There was some short-term connectivity interruption which caused a sudden increase in dialogs count. It’s normal for such a situation and they will end by the configured lifetime (‘default_timeout‘ parameter), e.g. 1 hour.
But what if we don’t want to wait and if we want to kill them manually?
The idea is to pick dialogs which were created during time range, assuming that you know an average call duration, and it’s obvious that if such calls are still shown by ‘opensips-cli -x mi dlg_list’ , it means that it is not valid alive call and you can kill it.
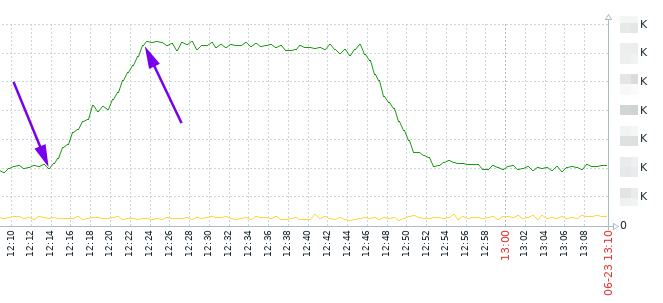
As it’s seen on the graph, the increasing was between 12:14 and 12:23. Let’s say it’s 12:30 now, and an average call duration is 30 … 60 seconds. So, we can kill dialogs which were created between 12:14 and 12:23 and which are still visible with ‘opensips-cli -x mi dlg_list’.
opensips-cli -x mi dlg_list > 2025-06-23_dlg_list.txtgrep datestart -B5 2025-06-23_dlg_list.txt | grep -B5 "2025-06-23 12:14:" | head | grep ID | awk '{ print $2}' | sed 's/"//g' | sed 's/,//g' > dlgs_12-14.txt
grep datestart -B5 2025-06-23_dlg_list.txt | grep -B5 "2025-06-23 12:15:" | head | grep ID | awk '{ print $2}' | sed 's/"//g' | sed 's/,//g' > dlgs_12-15.txt… and so on, up to 12:23. After that you’ll have several txt files with dialog IDs. Not it’s time to kill them:
for i in `echo $(cat dlgs_12-14.txt)` ; do opensips-cli -x mi dlg_end_dlg $i ; done… and the same for each file.